The Challenge
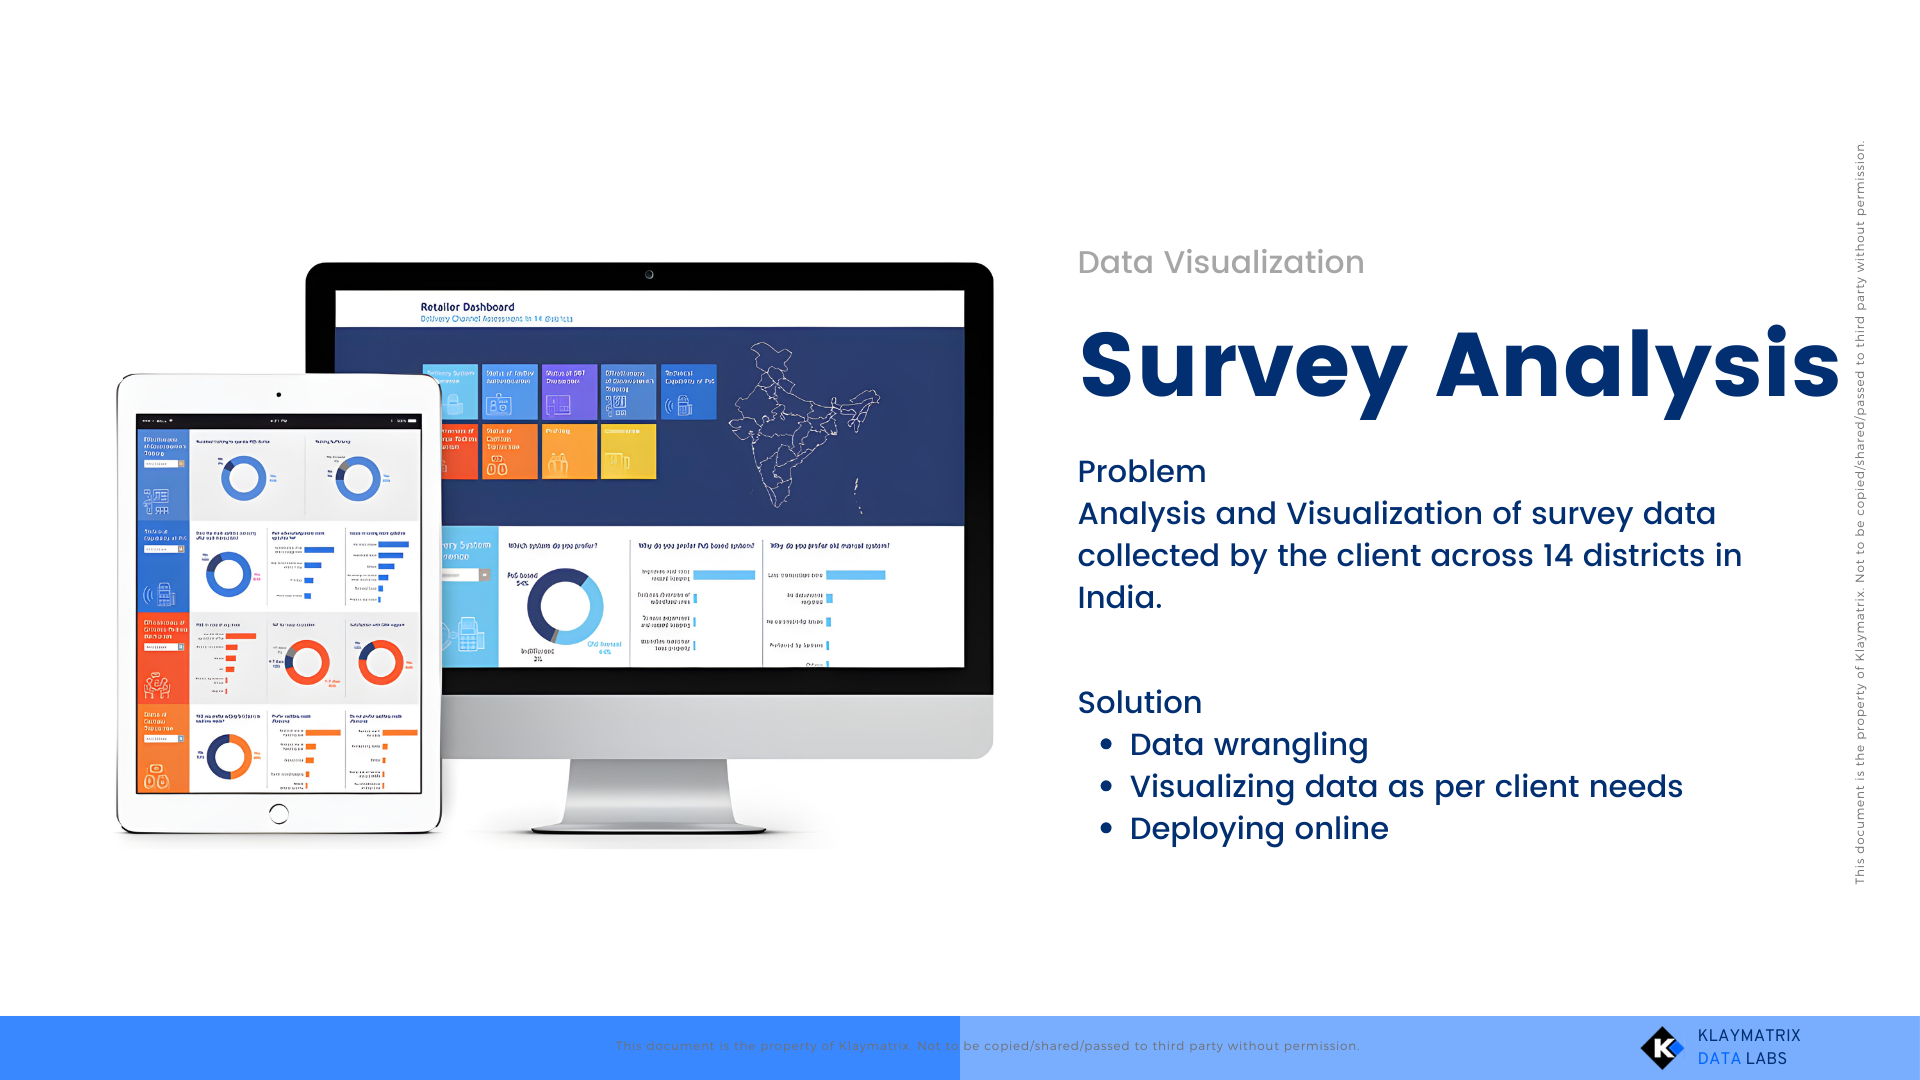
Client needed to make sense of complex survey data scattered across multiple formats: Unstructured Excel and Google Sheet along with data from Secondary public datasets
The data was rich in demographics and policy-related insights, but hard to work with and harder to visualize.
There was no internal data visualization capability and the team required support to design and deliver outputs that could be understood by policymakers and public stakeholders.